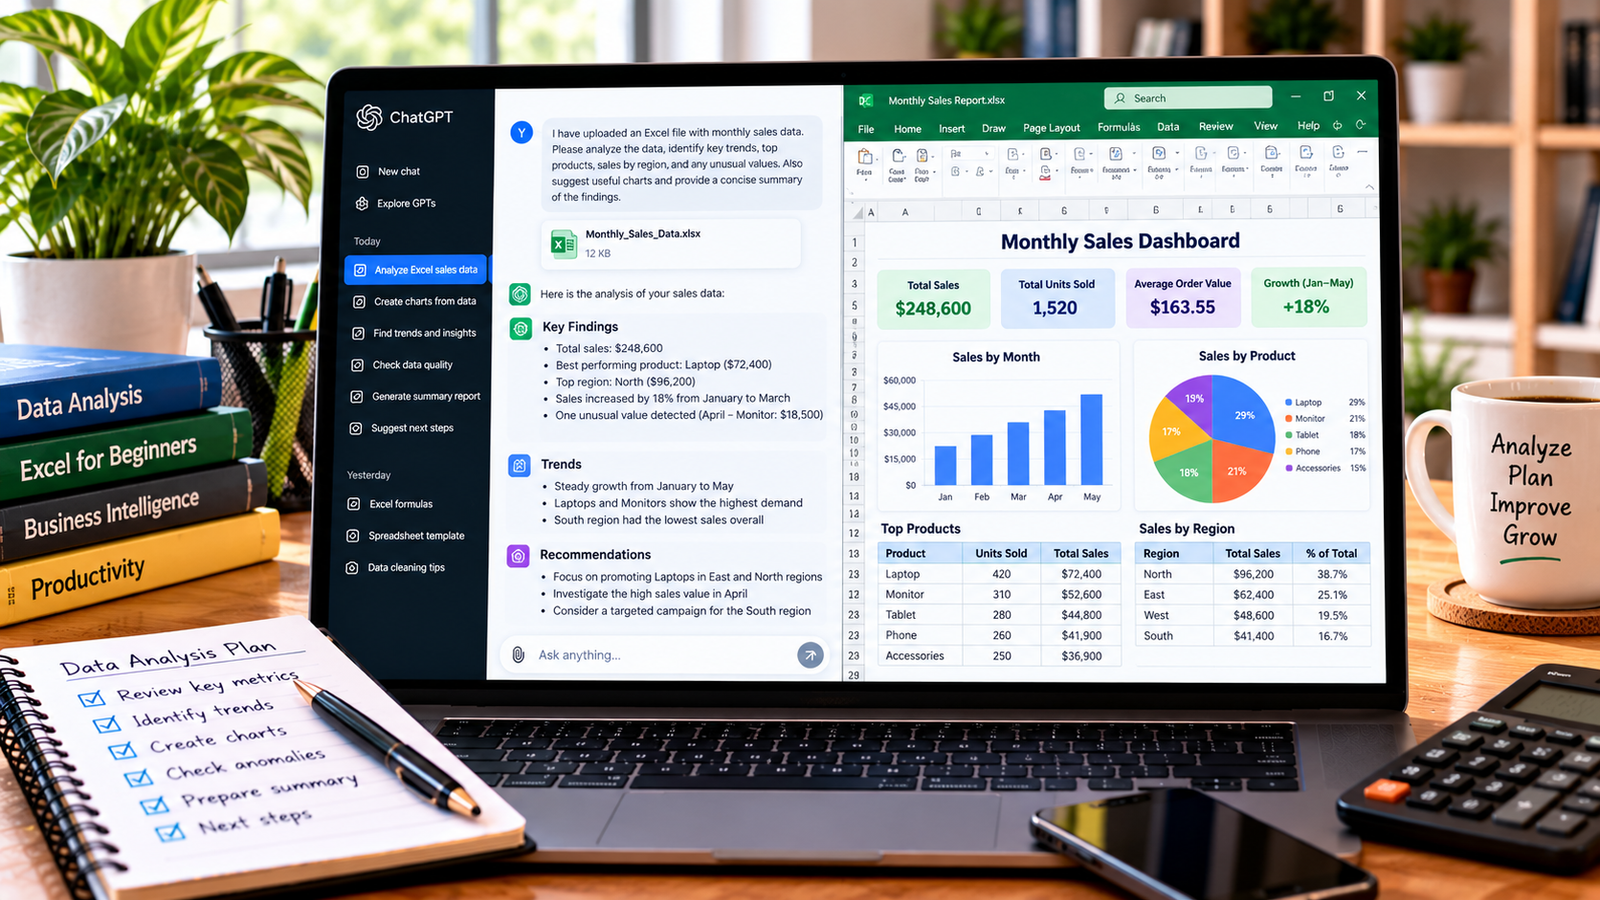
In this guide, you will learn how to create an Excel PivotTable, use ChatGPT to plan your analysis, and turn raw data into a useful report.
What Is an Excel PivotTable?
A PivotTable is an Excel feature that summarizes data into a structured report. It can group records, calculate totals, count entries, and compare values across categories.
For example, a sales spreadsheet might contain thousands of individual transactions. A PivotTable can summarize the data to show:
- Total sales by product.
- Revenue by region.
- Monthly sales performance.
- Quantity sold by category.
- Average transaction value.
Instead of writing a separate formula for every category, you can arrange fields in a PivotTable to summarize the information you need.
How Can ChatGPT Help with PivotTables?
ChatGPT can assist with planning and understanding PivotTable reports.
You can ask it to:
- Recommend a PivotTable layout for your business question.
- Explain which fields belong in Rows, Columns, Values, and Filters.
- Suggest whether to calculate a sum, count, or average.
- Explain how to group dates by month or year.
- Help troubleshoot incorrect totals or missing categories.
- Suggest charts to visualize the summarized results.
- Interpret the results after you have verified them.
ChatGPT does not automatically have access to your Excel workbook unless you provide the data or use a supported integration or file-analysis feature. You can still follow its instructions directly in Excel.
Step 1: Prepare Your Excel Data
Before creating a PivotTable, organize your spreadsheet into a simple table.
For example, suppose your sales data looks like this:
| Date | Product | Region | Units Sold | Sales Amount |
|---|---|---|---|---|
| 2026-01-05 | Notebook | North | 20 | 3,000 |
| 2026-01-08 | Pen Set | South | 15 | 3,000 |
| 2026-01-12 | Backpack | North | 5 | 12,500 |
| 2026-01-18 | Calculator | East | 8 | 9,600 |
| 2026-01-22 | Folder | South | 30 | 2,400 |
These are sample records for demonstration, not actual business data.
Before proceeding:
- Give each column a clear heading.
- Keep each transaction in a separate row.
- Remove unnecessary blank rows and columns.
- Check that dates and numbers use consistent formats.
- Review missing values and duplicate records.
- Make sure the Sales Amount column contains numeric values.
A clean dataset helps Excel calculate more reliable summaries.
Step 2: Ask ChatGPT to Plan Your PivotTable
Start by explaining the question you want the PivotTable to answer.
For example, if you want to compare total sales by product, use this prompt:
I have an Excel sales dataset with columns for Date, Product, Region, Units Sold, and Sales Amount. I want to summarize total sales by product. Explain how to create a PivotTable in Excel, identify which fields should go into Rows and Values, and tell me how to sort the results from highest to lowest sales.
ChatGPT should recommend placing Product in Rows and Sales Amount in Values, summarized by Sum.
This gives you a clear plan before you begin.
Step 3: Create a PivotTable in Excel
Once your data is ready, follow these steps:
- Open your Excel workbook.
- Click a cell inside your dataset.
- Select Insert from the ribbon.
- Choose PivotTable.
- Confirm the data range.
- Select a new worksheet or another suitable location.
- Click OK.
Excel creates a blank PivotTable and displays a field list. The available options may look slightly different depending on your Excel version.
You can now drag fields into the appropriate areas to create your report.
Step 4: Arrange the PivotTable Fields
Excel PivotTables commonly use four main areas.
- Rows: Categories displayed vertically, such as products or regions.
- Columns: Categories displayed horizontally, such as months or sales channels.
- Values: Numerical data to summarize, such as sales amounts or quantities.
- Filters: Fields used to filter the entire report, such as year or region.
For a report showing total sales by product, use this arrangement:
| PivotTable area | Field |
|---|---|
| Rows | Product |
| Columns | Leave empty |
| Values | Sales Amount, summarized by Sum |
| Filters | Region, if needed |
Excel will calculate the total sales for each product.
If you want to compare products across regions, put Product in Rows and Region in Columns, with Sales Amount in Values.
Step 5: Use ChatGPT to Create Different PivotTable Reports
You can use ChatGPT to plan several types of reports from the same dataset.
Report 1: Total Sales by Product
Prompt:
Explain how to create an Excel PivotTable that shows total sales by product. Tell me which fields to place in Rows and Values, and how to sort the total sales from largest to smallest.
Recommended setup:
- Rows: Product
- Values: Sum of Sales Amount
This helps identify which products contribute the most revenue.
Report 2: Sales by Region
Prompt:
I want to compare sales across different regions using an Excel PivotTable. Explain how to arrange the fields and display total sales for each region.
Recommended setup:
- Rows: Region
- Values: Sum of Sales Amount
This report makes regional comparisons easier.
Report 3: Monthly Sales
Prompt:
Explain how to create a PivotTable that summarizes sales by month using a Date field and Sales Amount field. Include instructions for grouping dates by month and year.
Recommended setup:
- Rows: Date, grouped by month and year
- Values: Sum of Sales Amount
If Excel does not group the dates correctly, check that the Date column contains valid Excel dates rather than text strings.
Report 4: Units Sold by Product and Region
Prompt:
Help me build an Excel PivotTable that compares units sold for each product across different regions. Explain which fields should go into Rows, Columns, and Values.
Recommended setup:
- Rows: Product
- Columns: Region
- Values: Sum of Units Sold
This lets you compare product performance across multiple regions in one report.
Step 6: Change the Calculation Type
Excel may automatically choose Sum or Count depending on the data and its format.
You can change the calculation when necessary.
For example, if you want to calculate average sales instead of total sales:
- Click a value in the PivotTable.
- Open the Value Field Settings option.
- Choose Average.
- Confirm the change.
You can also use Count to count records or transactions.
Ask ChatGPT:
My Excel PivotTable is counting the sales values instead of adding them. Explain how to change the Values calculation to Sum and what data-format issues I should check if the problem continues.
If Excel uses Count when you expected Sum, some cells may contain text or blank values. Inspect the source data before changing the report.
Step 7: Create a PivotChart
A PivotChart visualizes the information in a PivotTable and can update when the report changes.
To create one:
- Click inside your PivotTable.
- Open the Insert tab.
- Select PivotChart, if available in your Excel version.
- Choose an appropriate chart type.
- Add a clear chart title.
- Check the labels and values.
A column or bar chart is useful for comparing sales by product or region. A line chart can be useful for showing sales over time.
You can ask ChatGPT:
Recommend a suitable PivotChart for my sales PivotTable. Explain which chart type best communicates the results and suggest a clear title. Do not invent data or claim that the chart proves a cause for any trend.
Choose a chart that answers a specific question rather than adding visuals for decoration.
Step 8: Refresh the PivotTable When Data Changes
PivotTables do not always update automatically when you add or change source data.
To refresh a report:
- Update the original dataset.
- Click inside the PivotTable.
- Open the PivotTable Analyze tab or the relevant options in your Excel version.
- Select Refresh.
If you add rows outside the original source range, the PivotTable may not include them. Converting your source data into an Excel Table can make it easier to expand the dataset, although you may still need to refresh the PivotTable.
Step 9: Analyze and Explain the Results with ChatGPT
After creating the PivotTable, you can ask ChatGPT to help interpret the summarized results.
Copy the relevant totals into the conversation or upload a supported workbook if file analysis is available.
Use this prompt:
Review these verified PivotTable results. Summarize the highest and lowest sales categories, compare the regions, and identify patterns that may need further investigation. Separate observations from possible explanations and do not claim that one factor caused another without supporting evidence.
For example, if one region has higher sales than another, you can report the difference. However, you may need additional data about customer numbers, marketing spend, prices, or stock availability to understand why the difference occurred.
Always check that ChatGPT’s explanation matches the numbers in your PivotTable.
Common PivotTable Problems and Solutions
The PivotTable Shows Count Instead of Sum
Check whether the source column contains numbers stored as text. Correct the source data and refresh the PivotTable. Then change the Value Field Settings to Sum if appropriate.
Some Records Are Missing
Check the source data range, filters, blank fields, and any active report filters. New rows may fall outside the original source range.
Dates Are Not Grouping by Month
Confirm that the date column contains valid Excel dates. Text values, blank dates, or invalid entries may prevent grouping.
The Results Look Incorrect
Check for duplicate records, incorrect source ranges, and the selected calculation type. Compare a few PivotTable results with manual calculations.
New Data Does Not Appear
Refresh the PivotTable and confirm that the source range includes the new rows. Using an Excel Table as the source can help manage expanding datasets.
Frequently Asked Questions
Can ChatGPT create a PivotTable automatically?
ChatGPT can explain how to create PivotTables and help plan the layout. Whether it can directly create or edit a PivotTable in a downloadable Excel file depends on the tools available in your environment. Verify any generated workbook before using it.
Do I need advanced Excel skills to use PivotTables?
No. PivotTables are accessible to beginners once they understand how to prepare the source data and arrange fields in Rows, Columns, Values, and Filters.
Can a PivotTable calculate averages and percentages?
Yes. PivotTables support calculations such as Sum, Count, and Average, and can display certain values as percentages. The appropriate setup depends on what you want to measure.
Can I create a PivotTable from a large dataset?
Yes, provided the dataset fits within Excel’s supported limits and your computer can process it. Clean and organize the source data first, and use filters to focus on the information you need.
Are PivotTables better than formulas?
They serve different purposes. PivotTables are useful for summarizing and comparing categories, while formulas are useful for calculations within a worksheet. Many spreadsheets benefit from using both.
Final Thoughts
Excel PivotTables help turn large datasets into clear summaries without requiring you to calculate every category manually. ChatGPT can make the process easier by recommending layouts, explaining field settings, and helping troubleshoot errors.
Start with a clean dataset, create a PivotTable around one specific question, and verify the results. Once you are comfortable with the basics, explore date grouping, multiple fields, PivotCharts, and more advanced summaries.
Related reading: Learn how to analyze Excel data with ChatGPT and how to create an Excel spreadsheet with ChatGPT on TechLabMind.
About the Author