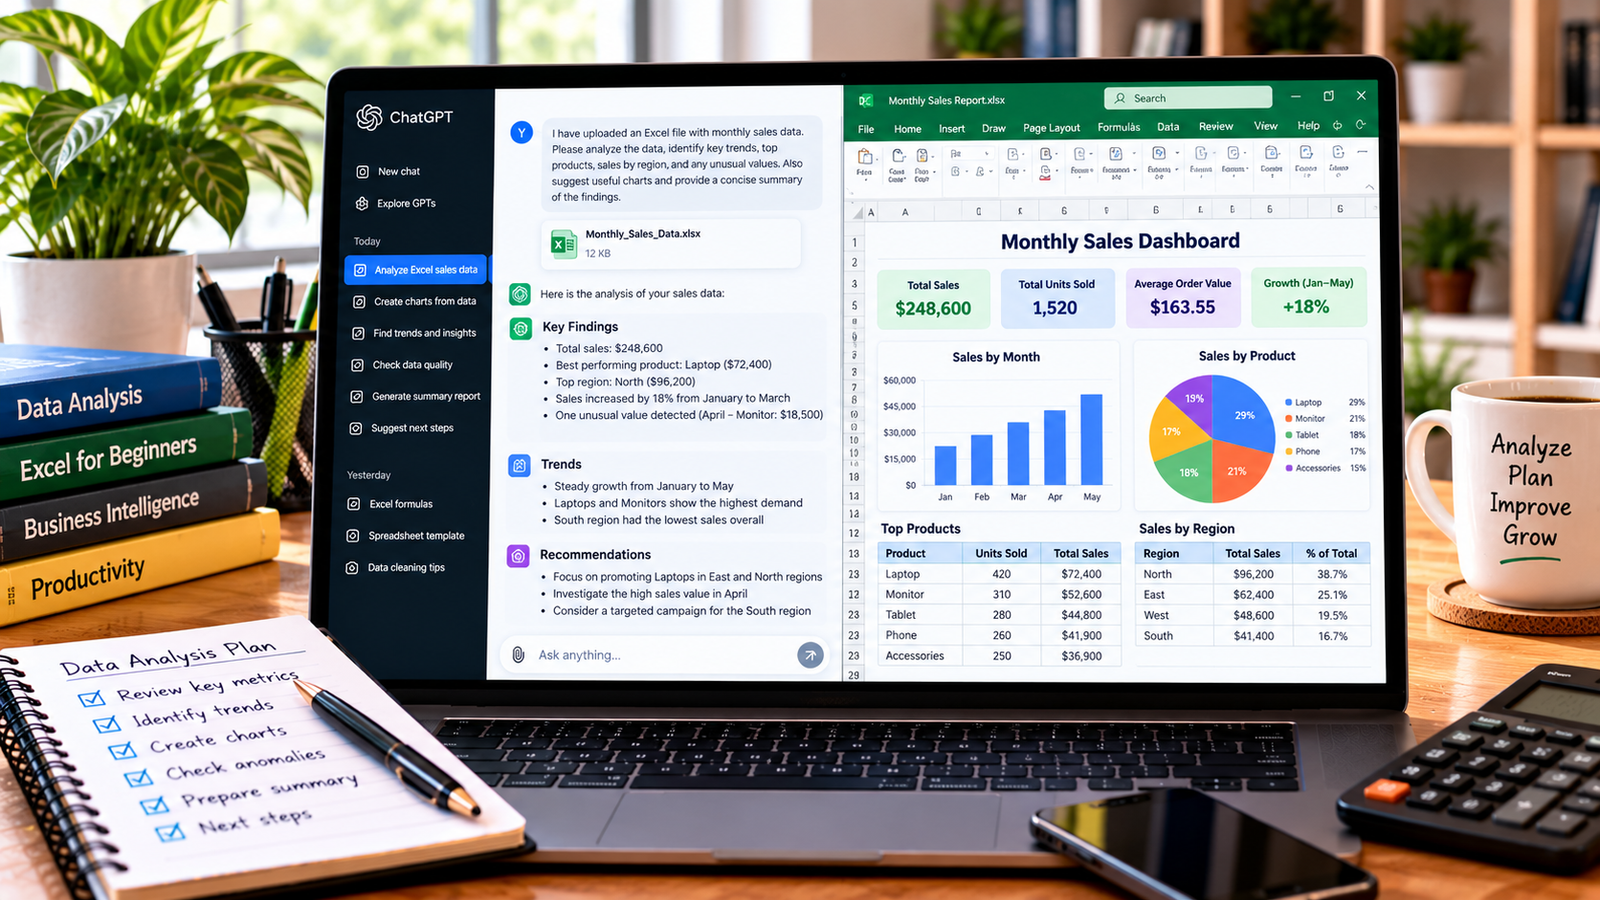
Excel charts make it easier to understand numbers, identify trends, and present information clearly. Instead of reviewing hundreds of spreadsheet rows, you can use a chart to compare sales, track monthly performance, or show changes over time.
If you are unsure which chart to use or how to create one, ChatGPT can help. It can recommend a suitable chart type, explain Excel’s chart tools, suggest formulas, write VBA code for certain tasks, and help you improve chart titles and labels.
In this guide, you will learn how to create Excel charts with ChatGPT, prepare your data, choose the right visualization, and troubleshoot common problems.
What Can ChatGPT Do for Excel Charts?
ChatGPT can help you plan and build charts, even if you are new to Excel. Its usefulness depends on your spreadsheet, the instructions you provide, and the version of Excel you use.
You can ask ChatGPT to:
- Recommend the best chart for your data.
- Explain how to create a chart in Excel.
- Suggest meaningful chart titles and axis labels.
- Help compare monthly sales, expenses, or product performance.
- Write formulas to calculate data before charting it.
- Generate VBA code to automate chart creation, when appropriate.
- Interpret chart results and suggest ways to make them clearer.
ChatGPT does not always create or insert a chart directly into your open Excel workbook. In many cases, it provides instructions, formulas, or code that you use in Excel. Always review the output before using it in a report.
Step 1: Prepare Your Excel Data
Before creating a chart, organize your data into a clear table. Each column should have a descriptive heading, and each row should represent one record or period.
For example, you might prepare monthly sales data like this:
| Month | Sales | Expenses |
|---|---|---|
| January | 12,000 | 7,000 |
| February | 15,000 | 8,500 |
| March | 18,000 | 9,000 |
| April | 16,000 | 8,200 |
| May | 22,000 | 11,000 |
The figures above are examples. Replace them with your actual data.
Before proceeding, check that:
- Column headings are present and understandable.
- Dates and numbers use consistent formats.
- There are no unnecessary blank rows inside the data.
- Each column contains the correct type of information.
- The data does not include totals that would distort the chart.
If your spreadsheet contains messy or inconsistent entries, ask ChatGPT how to clean the data before charting it.
Step 2: Ask ChatGPT Which Chart You Should Use
Different charts serve different purposes. Choosing the right one helps readers understand your information without confusion.
Here is a simple guide:
| Your goal | Suitable chart |
|---|---|
| Compare sales across products | Bar or column chart |
| Track sales over several months | Line chart |
| Show parts of a whole | Pie or doughnut chart, for a small number of categories |
| Compare two numerical variables | Scatter chart |
| Compare actual results with targets | Clustered column chart or bar chart |
| Show changes in expenses and revenue | Line or column chart |
You can ask ChatGPT to recommend a chart based on your data.
Example prompt:
“Act as an Excel data visualization expert. I have monthly sales and expenses for one year. Recommend the best chart type to compare these values over time. Explain why it is suitable and provide step-by-step instructions for creating it in Microsoft Excel.”
Read the recommendation and check whether it matches the purpose of your report.
Step 3: Ask ChatGPT for Excel Chart Instructions
Once you know which chart to use, request instructions for your particular data.
For example, if you want to create a chart comparing sales and expenses, use this prompt:
“Explain how to create a chart in Microsoft Excel using my Month, Sales, and Expenses columns. I want to compare sales and expenses for each month. Tell me which cells to select, which chart type to choose, how to add a chart title, and how to format the legend.”
ChatGPT should provide a sequence of steps you can follow. The exact menu names may vary slightly depending on your Excel version.
Step 4: Create the Chart in Microsoft Excel
After receiving the instructions, open your spreadsheet and follow these steps.
- Select the data you want to visualize, including the column headings.
- Open the Insert tab in Excel.
- Find the Charts section.
- Choose a recommended chart, such as a Line or Clustered Column chart.
- Check that the correct data appears in the chart.
- Add a descriptive chart title.
- Review the axis labels and legend.
- Resize and position the chart so that it is easy to read.
For the example above, a line chart can help show how sales and expenses change over the months.
If Excel places months in the legend instead of on the horizontal axis, use the chart’s Switch Row/Column option or adjust the data source. The correct option depends on how Excel interprets the selected range.
Step 5: Use ChatGPT to Improve the Chart
A chart may be technically correct but still difficult to understand. ChatGPT can suggest improvements to its presentation.
You can ask for help with:
- Writing a clear, informative title.
- Choosing readable axis labels.
- Deciding whether to display data labels.
- Selecting suitable colors for different series.
- Reducing unnecessary gridlines and visual clutter.
- Making the chart easier to understand in a presentation or report.
Example prompt:
“Review this chart description: it compares monthly sales and expenses from January to December. Suggest a concise title, appropriate axis labels, and practical formatting improvements. Keep the design professional and easy to read.”
If you upload a screenshot or supported spreadsheet file to ChatGPT, you may also ask it to review the visible chart or analyze the data. Avoid sharing confidential customer, employee, or business information unless you are authorized to do so.
Step 6: Create a Chart with an Excel Formula or VBA Code
For more advanced tasks, ChatGPT can help write formulas or VBA code that supports chart creation.
For example, you might want to calculate the percentage change in sales before visualizing it. You can ask:
“Write an Excel formula to calculate the percentage change between the previous month’s sales in B2 and the current month’s sales in B3. Explain how to copy the formula down the column and handle a previous value of zero.”
For VBA, you could ask:
“Write a VBA macro that creates a clustered column chart from a selected range containing Month and Sales columns. Explain where to paste the code and how to run it safely.”
Review any generated code before running it. Save a backup of your workbook first, and only enable macros from sources you trust. Code may need adjustments to match your worksheet names, cell ranges, or Excel version.
For routine charts, Excel’s built-in Insert Chart feature is usually the simplest approach.
Step 7: Ask ChatGPT to Interpret Your Chart Data
After creating a chart, you can use ChatGPT to summarize the underlying figures and identify patterns.
For example, ask:
“Based on the monthly sales data below, identify the highest and lowest sales months, describe the overall trend, and calculate the percentage change from January to May. Use only the supplied figures and show your calculations.”
Provide the relevant values or upload a supported file if you want ChatGPT to analyze the actual data.
Always verify numerical conclusions in Excel, especially when the results will be used in financial reports, business decisions, or client presentations. A chart may show a pattern, but it does not necessarily explain why that pattern occurred.
Common Problems When Creating Excel Charts with ChatGPT
1. The chart displays the wrong data
Check the selected cell range and use Excel’s Select Data option to review the data series and category labels.
2. Months appear in the wrong order
Make sure the month column contains real Excel dates or consistently formatted month values. Text-based month names may sort alphabetically rather than chronologically.
3. The chart looks crowded
Remove unnecessary data series, shorten labels, and consider using a bar chart or line chart. Avoid adding too many colors and data labels.
4. ChatGPT recommends an unsuitable chart
Explain what you want the reader to understand. For example, tell ChatGPT whether you need to compare categories, track a trend, or show proportions. Ask it to justify its recommendation.
5. The generated formula or VBA code does not work
Share the exact error message, your Excel version, and a small example of the data structure. Ask ChatGPT to revise the solution. Test it on a copy of your workbook first.
Tips for Better Results
Use these practices to get more useful help from ChatGPT:
- Explain your goal: Say what you want the chart to communicate.
- Describe your columns: Include column names and a few sample rows.
- Mention your Excel version: Some features differ between desktop, web, and older versions.
- Ask for step-by-step instructions: This is easier to follow than a general explanation.
- Check the output: Confirm that chart values, labels, and calculations match your source data.
- Keep the design simple: Prioritize readability over decorative effects.
For related spreadsheet tasks, see our guides on analyzing Excel data with ChatGPT, creating an Excel spreadsheet with ChatGPT, and creating Excel formulas with ChatGPT.
Frequently Asked Questions
Can ChatGPT create charts in Excel?
ChatGPT can recommend chart types, explain the steps, generate formulas, and write code that can automate certain chart tasks. Whether it can create or edit a workbook directly depends on the tools and features available in your current setup.
Which Excel chart is best for sales data?
A column or bar chart is useful for comparing sales across products or regions. A line chart is often suitable for showing how sales change over time. The best option depends on the question you want the chart to answer.
Can ChatGPT create an Excel chart from a prompt?
It can provide instructions or code based on your prompt. If your version of ChatGPT supports working with uploaded spreadsheets, you may also be able to provide a file for analysis. You may still need to create or adjust the chart in Excel.
Can ChatGPT write VBA code for Excel charts?
Yes, ChatGPT can generate example VBA code for tasks such as creating charts or changing chart titles. However, code can contain errors or assumptions about your workbook. Review and test it on a backup before running it.
Is ChatGPT accurate when analyzing Excel charts?
It can be helpful for identifying trends and explaining data, but its conclusions are not guaranteed to be correct. Verify calculations and observations against the original spreadsheet.
Final Thoughts
Creating Excel charts with ChatGPT can make spreadsheet work easier, especially when you are unsure which chart to choose or how to format it. Start with organized data, describe your goal clearly, and use ChatGPT’s recommendations to build a chart in Excel.
Before sharing the finished chart, check the values, labels, and conclusions against your original data. A clear chart supported by accurate information will make your reports easier to understand and more useful for decision-making.
About the Author