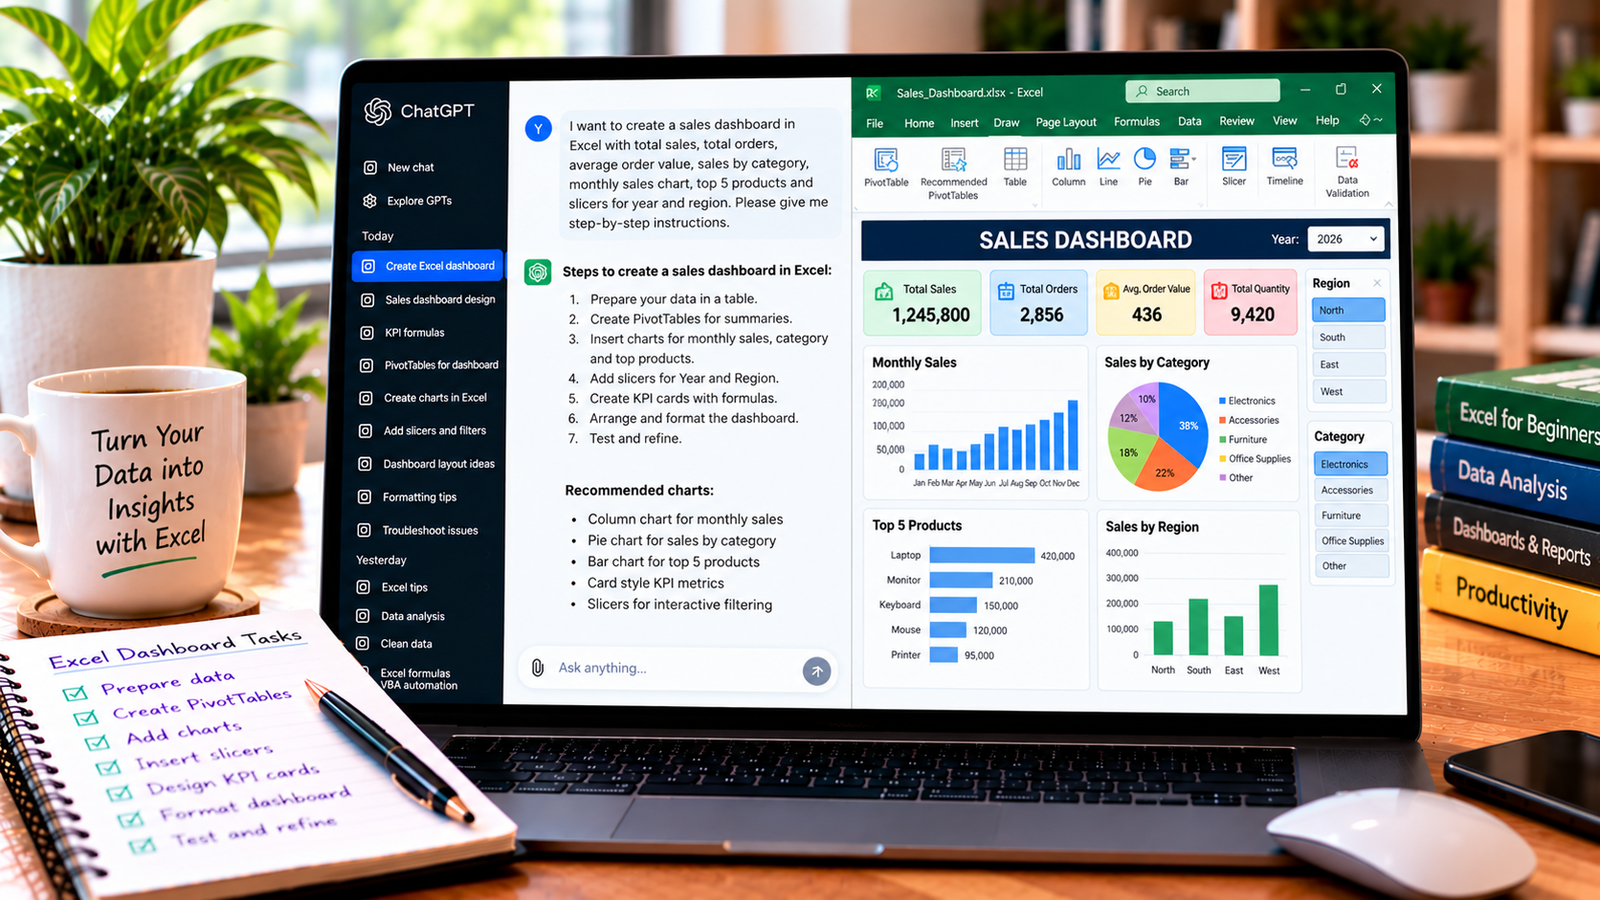
Preparing Excel reports manually can take a lot of time, especially when you repeat the same process every day, week, or month. You may need to clean data, calculate totals, summarize results, create charts, and format everything before sharing the report.
ChatGPT can help you simplify this workflow by generating Excel formulas, suggesting PivotTables, writing VBA macros, and explaining how to build repeatable reporting processes.
In this guide, you will learn how to automate Excel reports with ChatGPT, from preparing your source data to generating summaries and updating reports more efficiently.
What Does Excel Report Automation Mean?
Excel report automation means using formulas, built-in Excel features, or code to reduce repetitive reporting tasks.
For example, a monthly sales report might require you to:
- Import new sales records.
- Clean inconsistent entries.
- Calculate total revenue and order counts.
- Summarize results by product or region.
- Create charts to show trends.
- Format the report for management.
- Check the figures before sharing the results.
You can automate many of these steps without automating everything. A well-designed workflow combines reliable Excel features with ChatGPT’s help in creating formulas, code, and instructions.
Step 1: Organize Your Source Data
Start by making sure your source data has a consistent structure.
For example, a sales report might contain the following columns:
| Order Date | Order ID | Product | Region | Quantity | Sales |
|---|---|---|---|---|---|
| 2026-01-05 | ORD101 | Laptop | North | 2 | 144,000 |
| 2026-01-08 | ORD102 | Mouse | South | 5 | 7,500 |
| 2026-01-12 | ORD103 | Monitor | East | 3 | 72,000 |
| 2026-01-18 | ORD104 | Keyboard | West | 4 | 8,000 |
These are sample figures for illustration.
Before automating the report:
- Use clear column headings.
- Keep dates and numbers in consistent formats.
- Check for missing values and duplicate records.
- Make sure each field contains the correct type of information.
- Convert the data range into an Excel Table using Insert > Table.
Give the table a meaningful name, such as SalesData, using the Table Design tab. A structured table can expand when new rows are added, making it easier to reuse formulas and reporting steps.
Step 2: Ask ChatGPT to Design Your Reporting Workflow
Before writing formulas or code, explain what the report should contain and how often it needs to be prepared.
Use this prompt:
“Act as an Excel reporting specialist. I prepare a monthly sales report using columns for Order Date, Order ID, Product, Region, Quantity, and Sales. Design a repeatable workflow that calculates total sales, counts unique orders, summarizes results by region and product, creates charts, and formats the final report. Recommend which steps should use Excel formulas, PivotTables, or VBA.”
ChatGPT can suggest a workflow based on your requirements. Review the plan and choose the simplest reliable approach.
For example, formulas may be sufficient for basic calculations, PivotTables may be better for category summaries, and VBA may help automate repetitive formatting or worksheet creation.
You do not need a macro for every task. Built-in Excel features are often easier to maintain.
Step 3: Automate Calculations with Excel Formulas
Formulas are useful when your report needs to calculate the same metrics every time new data arrives.
If your Excel Table is named SalesData, you can calculate total sales with:
=SUM(SalesData[Sales])
To calculate total units sold:
=SUM(SalesData[Quantity])
To count unique orders in a version of Excel that supports dynamic array functions, you could use:
=COUNTA(UNIQUE(SalesData[Order ID]))
This formula assumes that every order ID is populated and that blank or invalid IDs have been handled appropriately. If your version of Excel does not support UNIQUE, another method may be needed.
Ask ChatGPT:
“Write Excel formulas for total sales, total units sold, and unique order count using an Excel Table named SalesData. Explain the assumptions behind each formula and provide alternatives for older Excel versions.”
Test the formulas against a small sample and confirm the results with a manual calculation or another trusted method.
For more examples, read our guide on creating Excel formulas with ChatGPT.
Step 4: Create Automatic Summaries with PivotTables
PivotTables are useful when your report needs totals by product, month, category, or region.
To create a PivotTable:
- Select a cell inside your
SalesDatatable. - Open Insert > PivotTable.
- Choose the source table.
- Place the PivotTable on a new worksheet or in a suitable location.
- Drag the fields into Rows, Columns, Values, and Filters.
- Set the appropriate calculation, such as Sum of Sales.
For example, placing Region in Rows and Sales in Values creates a summary of sales by region.
You can also summarize sales by product or date. If you group dates by month, confirm that Excel is interpreting the dates correctly and that the report uses the intended period.
Ask ChatGPT:
“Help me build an Excel PivotTable that summarizes monthly sales by region. Explain which fields to place in Rows, Columns, Values, and Filters, and how to refresh the PivotTable when new records are added.”
PivotTables generally need to be refreshed after their source data changes. Depending on your workflow, you can refresh them manually or configure an appropriate refresh process.
See our tutorial on creating Excel PivotTables with ChatGPT.
Step 5: Automate Report Charts
Charts make recurring reports easier to understand by showing trends and comparisons visually.
For a sales report, you might use:
- A line chart for monthly sales trends.
- A bar chart for sales by region.
- A column chart for product comparisons.
- A chart comparing actual sales with targets, if target data is available.
Create the chart from a summary table or PivotTable rather than from a range that contains unrelated information.
You can ask ChatGPT:
“Recommend charts for a monthly sales report containing sales by month, product, and region. Give me step-by-step Excel instructions for creating each chart and suggest clear titles and labels.”
Keep the design consistent between reporting periods. Use descriptive titles, readable number formats, and only the visual elements that help readers interpret the data.
Step 6: Use VBA to Automate Repetitive Tasks
If you repeat the same formatting or worksheet preparation steps, a VBA macro may save time.
For example, a simple macro could bold the first row, apply an AutoFilter, and adjust column widths.
Sub FormatSalesReport()

    With ActiveSheet.Rows(1)
        .Font.Bold = True
        .AutoFilter
    End With

    ActiveSheet.Columns.AutoFit

End Sub
This example assumes that the first row contains the column headings and that the active worksheet is the intended report sheet. It does not create a full report or verify the underlying data.
You can ask ChatGPT to adapt the macro:
“Modify this VBA macro so it formats a worksheet named Monthly Report, applies a consistent number format to the Sales column, and adjusts the column widths. Explain the code and identify any assumptions about the worksheet layout.”
Review the generated code before running it. Save a backup first, test the macro on a copy, and use a macro-enabled workbook format such as .xlsm if you need to retain VBA code.
Only run macros you understand and trust.
Step 7: Create a Repeatable Monthly Reporting Process
Once the formulas, PivotTables, charts, and formatting are ready, document the process so you can reuse it.
A basic monthly workflow might look like this:
- Add the new month’s records to the source table.
- Check for missing values, duplicate records, and formatting issues.
- Confirm that formulas include the updated data.
- Refresh PivotTables and connected charts.
- Run any tested formatting macro, if required.
- Review the final report and compare key totals with the source data.
- Save the report using a consistent file name.
ChatGPT can help turn these steps into a checklist or adapt them to your particular reporting needs.
Some tasks can be automated completely, while others still require a person to review the figures and approve the final report.
Step 8: Check the Report Before Sharing It
Automation reduces manual work, but it does not guarantee that the report is correct.
Before sharing your report, check:
- Whether the reporting period is correct.
- Whether all expected records are included.
- Whether duplicate records have been handled appropriately.
- Whether totals match the source data.
- Whether formulas and PivotTables are up to date.
- Whether charts show the correct figures.
- Whether the report contains confidential information that should not be shared.
You can ask ChatGPT to create a validation checklist, but verify the figures directly in Excel.
If the report supports financial, operational, or other important decisions, use a trusted source to reconcile the results.
Common Mistakes to Avoid
Automating a poorly organized spreadsheet
Inconsistent headings, mixed data types, and missing values can lead to unreliable results. Improve the source data before automating the workflow.
Counting rows instead of unique orders
One order may contain multiple product rows. Choose a counting method that matches the structure of your data.
Forgetting to refresh PivotTables
New records may not appear in the report until the PivotTables are refreshed.
Running untested VBA code
A macro can modify or delete data. Test generated code on a backup and check its assumptions.
Assuming automation removes the need for review
Formulas, code, and source data can all contain errors. Review the output before sharing it.
Frequently Asked Questions
Can ChatGPT automate Excel reports?
ChatGPT can help generate formulas, write VBA code, plan PivotTables, recommend charts, and explain reporting workflows. Directly editing a workbook or running automation depends on the tools and features available in your current setup.
What is the easiest way to automate an Excel report?
Start with an Excel Table, use formulas for recurring calculations, and create PivotTables for summaries. Add macros only when they solve a repetitive task that cannot be handled more simply.
Can Excel reports update automatically when new data is added?
Formulas that reference a structured Excel Table can often include new rows automatically. PivotTables generally need refreshing, and charts or other report elements must be configured to use the appropriate source data.
Can ChatGPT create a monthly report template?
Yes. ChatGPT can suggest a template layout, generate formulas, provide VBA examples, and explain how to set up charts and summary tables. You will need to build or adapt the template in Excel and verify the results.
Is VBA required for Excel report automation?
No. Many reports can be streamlined with Excel Tables, formulas, PivotTables, and charts. VBA is an option for tasks that benefit from additional automation.
Final Thoughts
Automating Excel reports with ChatGPT can reduce repetitive work and make your reporting process more consistent. Start with clean data, reliable formulas, and useful PivotTables, then add charts and tested macros where they provide real value.
Most importantly, validate the final report before sharing it. A well-designed automated workflow should save time while keeping the results accurate, understandable, and easy to maintain.
About the Author